
Analysis reveals fixed-variable rate gap
Some interesting new data sheds interesting light on the eternal debate over whether to have a variable or fixed home loan.
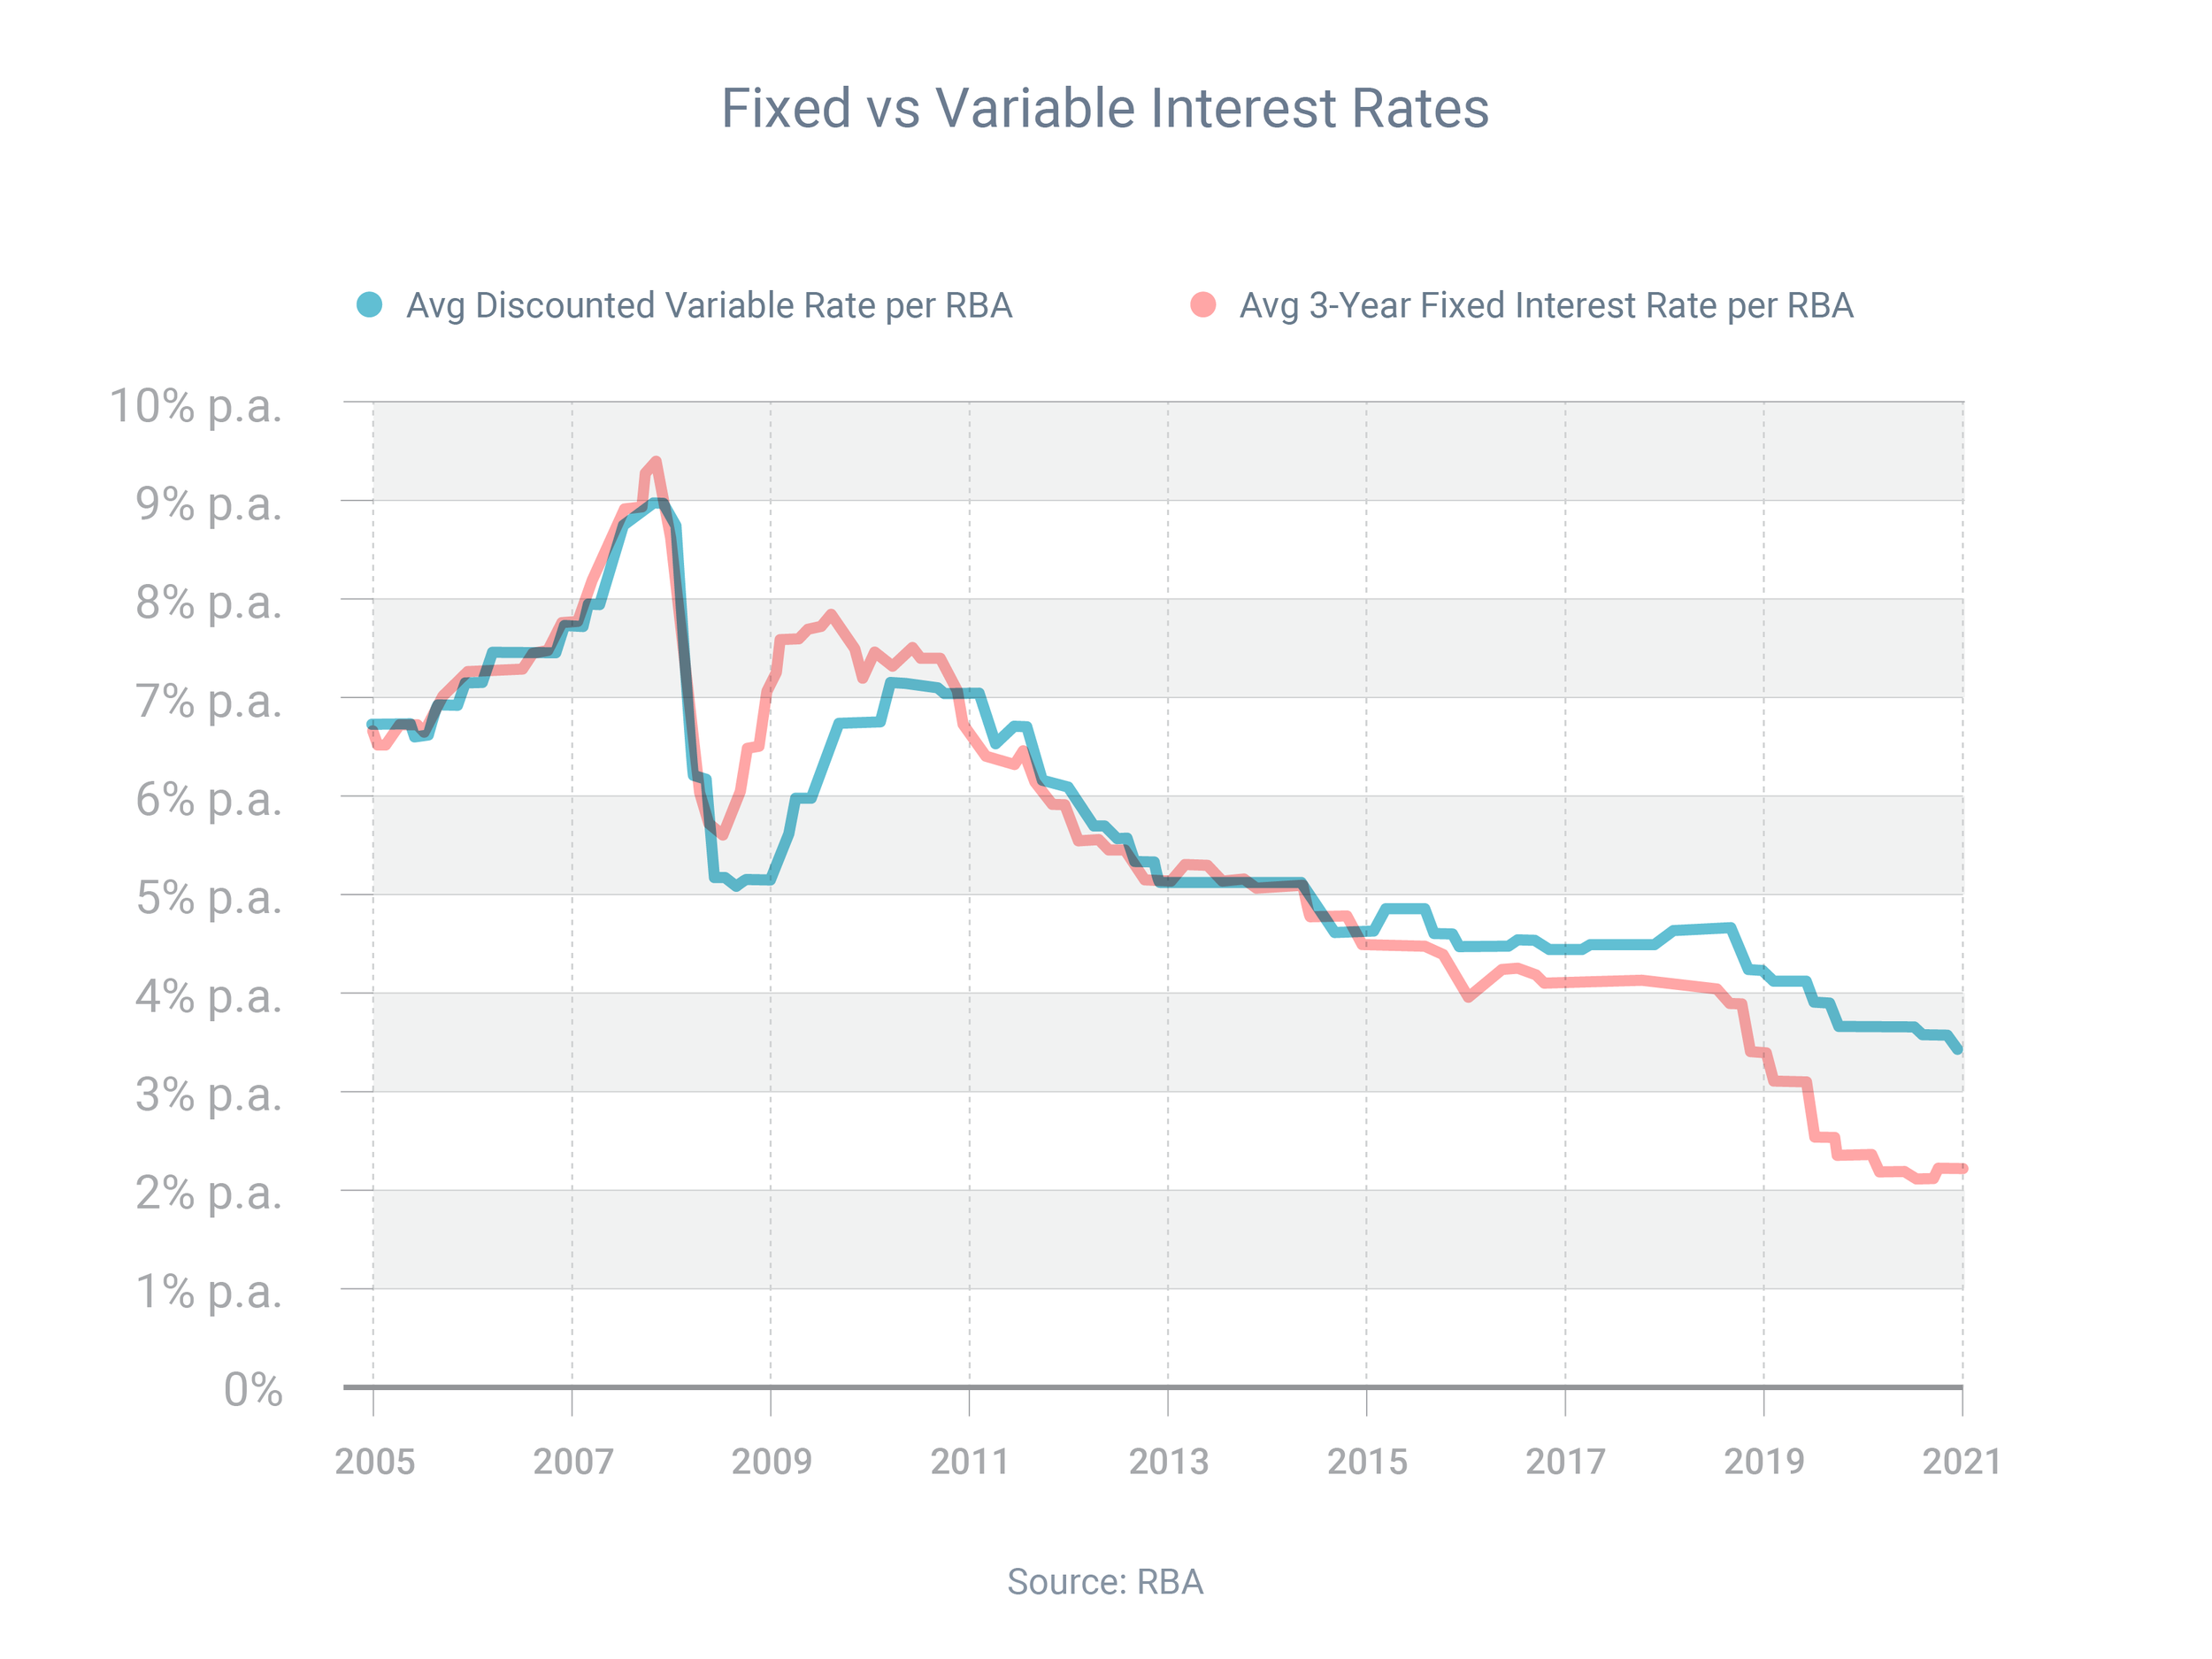
Reserve Bank of Australia data for August shows owner-occupiers on three-year fixed loans were paying, on average, 1.26 percentage points less than those on the discounted variable rate.
However, as the graph shows, these things move in cycles. The gap between fixed and variable rates might start closing, with the Reserve Bank signalling it will start increasing official interest rates once the economy strengthens.
If you're wondering whether to go fixed or variable, here are three things to consider:
· Does your variable rate have features a fixed loan might not have?
· Do you want the repayment certainty that comes from a fixed loan?
· Have you considered a split loan, which is part variable and part fixed?